The Data Hierarchy
Most organizations collect data. Few transform it into intelligence. The difference lies in understanding the hierarchy from raw data to strategic action.
Five Levels of Data Maturity
Level 1 - Data Collection: You capture what happens in your systems. Logs, events, user actions. This is foundational but not valuable alone. Data sitting unused is just storage cost. Level 2 - Data Organization: You structure data for querying. Databases, data warehouses, schemas that make information retrievable. This enables analysis but doesn't provide it. Level 3 - Data Analysis: You identify patterns and trends. What's working? What's not? Where are the opportunities? Analysis turns data into information, but information alone doesn't drive action. Level 4 - Data Insights: You understand why patterns exist and what they mean for your business. Insights connect data to strategy. They answer 'so what?' and point toward action. Level 5 - Data Intelligence: You automate the path from data to action. Systems make decisions based on data without human intervention. Intelligence compounds because each action generates new data that improves future decisions. Most organizations get stuck at Level 2 or 3. They have data and can analyze it, but analysis doesn't translate to outcomes. Moving to Level 4 and 5 requires different thinking about what data is for.
Designing Data Systems
The Instrumentation Mindset
Effective data systems start with intentional instrumentation. Don't just log errors and system events. Capture business events: user behaviors, decision points, outcomes. Every interaction is a data point. Every outcome is a training signal. The key is structure. Unstructured logs are hard to analyze at scale. Structured events with consistent schemas enable systematic analysis. Define your event taxonomy before you start capturing data.
The Event-Driven Architecture
Build systems that communicate through events, not just API calls. When something significant happens, publish an event. Multiple systems can react to the same event independently. This creates data flow without tight coupling. Events serve two purposes: they coordinate system behavior and they create audit trails. Every business action leaves a record. This history becomes the foundation for analysis and learning.
Schema Evolution
Your understanding of what to track will evolve. Design for schema changes from the start. Use schema registries. Version your events. Add fields without breaking old consumers. Data systems must accommodate learning. The anti-pattern is rigid schemas that prevent evolution. If adding a field requires updating dozens of systems, you won't add fields. Your data capture stagnates. Flexible schemas enable continuous improvement.
From Data to Insights
The Analysis Pipeline
Moving from raw data to actionable insights requires systematic transformation. Raw events flow into storage. Batch or stream processing aggregates and enriches them. Analysis queries run against processed data. Results inform decisions. Each stage adds value. Raw data is complete but unwieldy. Aggregated data is efficient but summarized. The right level of aggregation depends on your questions. Build for multiple levels of granularity.
Metrics That Matter
Not all metrics are created equal. Vanity metrics look impressive but don't guide decisions. Actionable metrics directly inform what to do next. Focus on metrics that have clear thresholds that trigger action. Good metrics share characteristics: they're understandable to stakeholders, comparable over time, tied to business outcomes, and have known ranges for success and failure. If a metric moves but no one changes behavior, it's not useful.
The Cohort Analysis Pattern
Averages hide truth. Analyzing users by cohort reveals patterns that aggregates obscure. Group users by when they joined, which features they use, or how they found you. Compare cohort behavior over time. Cohort analysis exposes what's working and what's not. If recent cohorts retain better than old ones, something improved. If they retain worse, something broke. This attribution is impossible with aggregate metrics.
Experiment-Driven Learning
The best data systems enable rapid experimentation. A/B test changes. Measure impact. Learn systematically. Every experiment adds to organizational knowledge about what works. This requires infrastructure: feature flags, experiment tracking, statistical analysis, and clear protocols for rolling out winners. Build these capabilities early. They compound over time as you accumulate validated learnings.
Automating Intelligence
Manual analysis doesn't scale. The goal is systems that learn from data automatically and apply those learnings without human intervention. This is where data becomes true intelligence.
The Feedback Loop
Intelligent systems operate in continuous loops: observe behavior, analyze patterns, make predictions, take action, measure outcomes, learn from results. Each cycle improves the next. The key is closing the loop. Many systems collect data and analyze it, but don't feed insights back into operations. The analysis remains separate from execution. Close this gap. Let data drive action directly.
Personalization at Scale
One powerful application of automated intelligence is personalization. Systems learn what each user prefers and adapt behavior accordingly. Recommendations, content ordering, feature highlighting all become dynamic based on individual patterns. This requires infrastructure that can make decisions in real-time based on user history. The decision logic must be fast (milliseconds) and reliable. Pre-compute what you can. Cache aggressively. Use approximations when exact answers are too slow.
Anomaly Detection
Automated systems should identify unusual patterns without manual monitoring. Train models on normal behavior. Alert when reality deviates significantly. This catches problems before they become crises. Good anomaly detection reduces alert fatigue by learning what matters. Not every deviation is important. Systems should distinguish between noise and signal, surfacing only anomalies that require human attention.
Predictive Analytics
The most sophisticated data intelligence predicts future outcomes. Which customers will churn? Which leads will convert? What inventory levels will be needed next month? Predictions enable proactive rather than reactive operations. Start with simple predictions based on historical patterns. Gradually incorporate more sophisticated models as you validate their value. The goal isn't perfect predictions but better-informed decisions than you'd make without them.
Data Governance and Quality
Intelligence is only as good as the data it's built on. Poor quality data leads to poor decisions. Data governance isn't bureaucracy, it's a competitive necessity.
The Five Dimensions of Data Quality
Accuracy: Does the data reflect reality? Incorrect data is worse than missing data because it creates false confidence. Validate data at entry points. Completeness: Are all required fields present? Missing data limits analysis. Design systems to capture complete information, but handle gracefully when fields are absent. Consistency: Do the same facts appear the same way everywhere? Inconsistent data makes aggregation difficult. Standardize formats and definitions across systems. Timeliness: Is data fresh enough for its purpose? Real-time decisions need recent data. Historical analysis tolerates staleness. Match data freshness to use case requirements. Validity: Does data conform to expected formats and ranges? Invalid data breaks analysis pipelines. Validate at write time, not read time.
Privacy and Compliance
Data intelligence must respect privacy. Collect only what you need. Secure what you collect. Delete what you no longer need. Comply with regulations like GDPR and CCPA. Privacy violations destroy trust and create liability. Build privacy into system design, not as an afterthought. Anonymize data where possible. Implement access controls. Audit who accesses what. Make privacy a competitive advantage, not just a compliance checkbox.
Data Lineage
Track where data comes from and how it transforms. When analysis produces unexpected results, you need to trace back to root causes. Without lineage, debugging is guesswork. Lineage also enables impact analysis. If you change a data source or transformation, what downstream analyses are affected? Good lineage tracking answers this automatically.
Building Data Intelligence Culture
Technology enables data intelligence, but culture determines whether it's used effectively. The best data systems are worthless if decisions remain intuition-driven.
Decision Protocols
Establish clear protocols for how data informs decisions. What metrics matter for each decision type? What thresholds trigger action? Who has authority to act on data? Explicit protocols prevent data from being ignored. Document decision criteria before analyzing data. This prevents cherry-picking data to support predetermined conclusions. Set standards for statistical significance. Require experiments for major changes.
Data Literacy
Everyone needs basic data literacy. Understanding statistical significance, correlation vs causation, and how to interpret visualizations aren't specialized skills. They're baseline requirements for data-driven organizations. Invest in training. Make data tools accessible. Celebrate data-informed decisions. Create feedback loops where teams learn from their data-driven experiments. Literacy compounds as people see data delivering results.
The Compounding Advantage
Data intelligence creates compounding advantages. Better data enables better decisions. Better decisions create better outcomes. Better outcomes generate better data. The loop accelerates. Organizations that establish this flywheel early build advantages that competitors struggle to match. They don't just have more data, they have systems that learn from data faster. This learning velocity becomes the competitive moat. Start building your data intelligence capability today. Instrument your systems. Structure your data. Build analysis pipelines. Automate insights. Most importantly, use what you learn to make better decisions. The sooner you start, the more advantage you compound. Data intelligence isn't a project with an end date. It's an ongoing practice of turning information into advantage. Begin now.
Trace a metric back to its definition
Work a small synthetic disagreement
Take four received event payloads with IDs e1, e1, e2, and e3. They represent two people. Received deliveries equal four, distinct events equal three, and distinct people equal two. The editorial fixture calculates these values from synthetic records. These are different denominators, not competing measurements of one fact. Before asking an assistant to explain a dashboard, define the question: deliveries received, attempts made, people active, or bookings completed. No amount of natural-language polish can resolve a metric whose meaning was never agreed.
The lineage of an answer
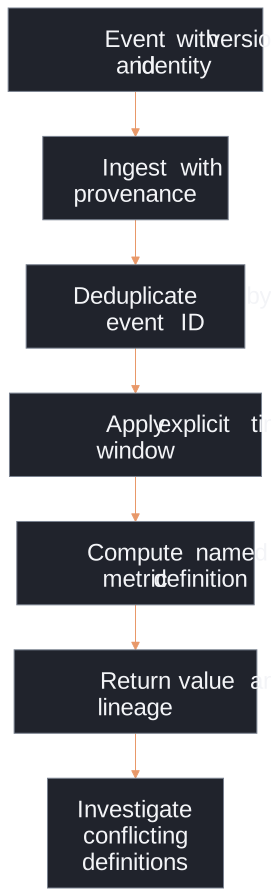
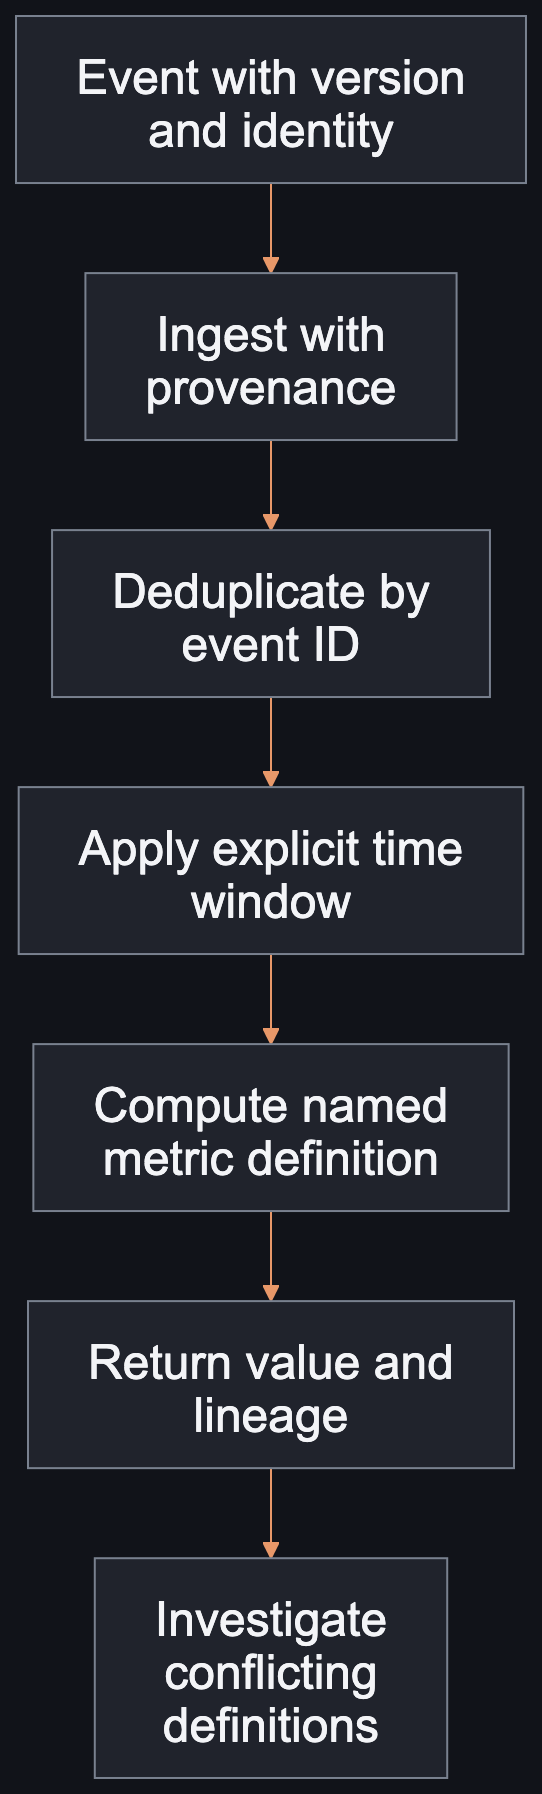
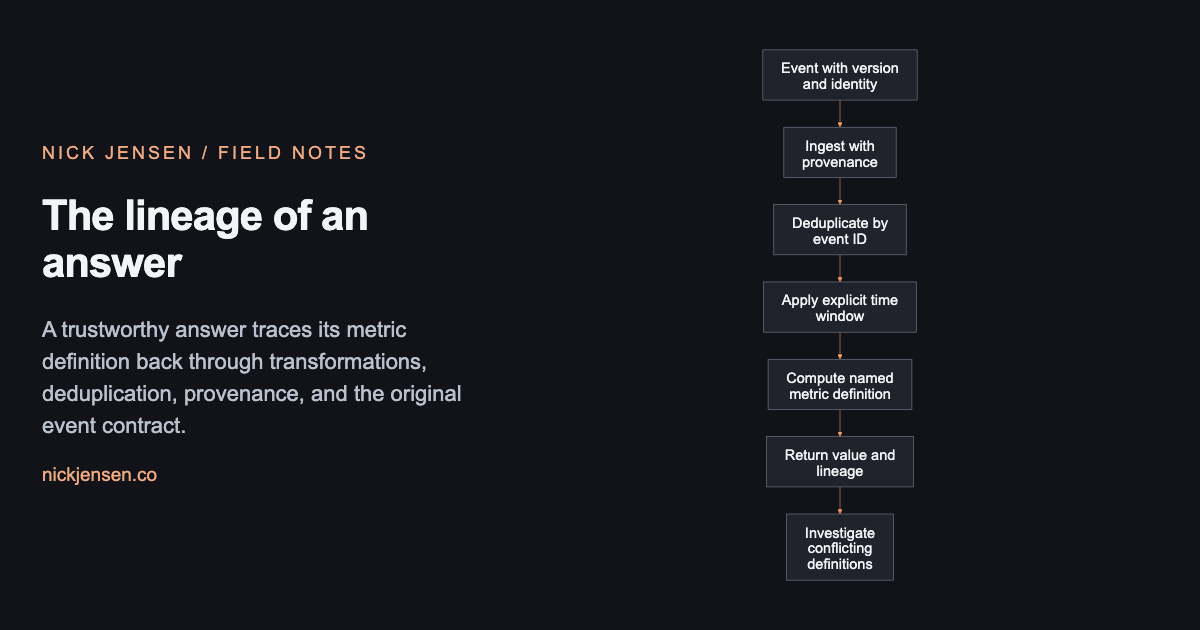
A trustworthy answer traces its metric definition back through transformations, deduplication, provenance, and the original event contract.
Illustrative framework · Graphic by Nick JensenRead the diagram as text
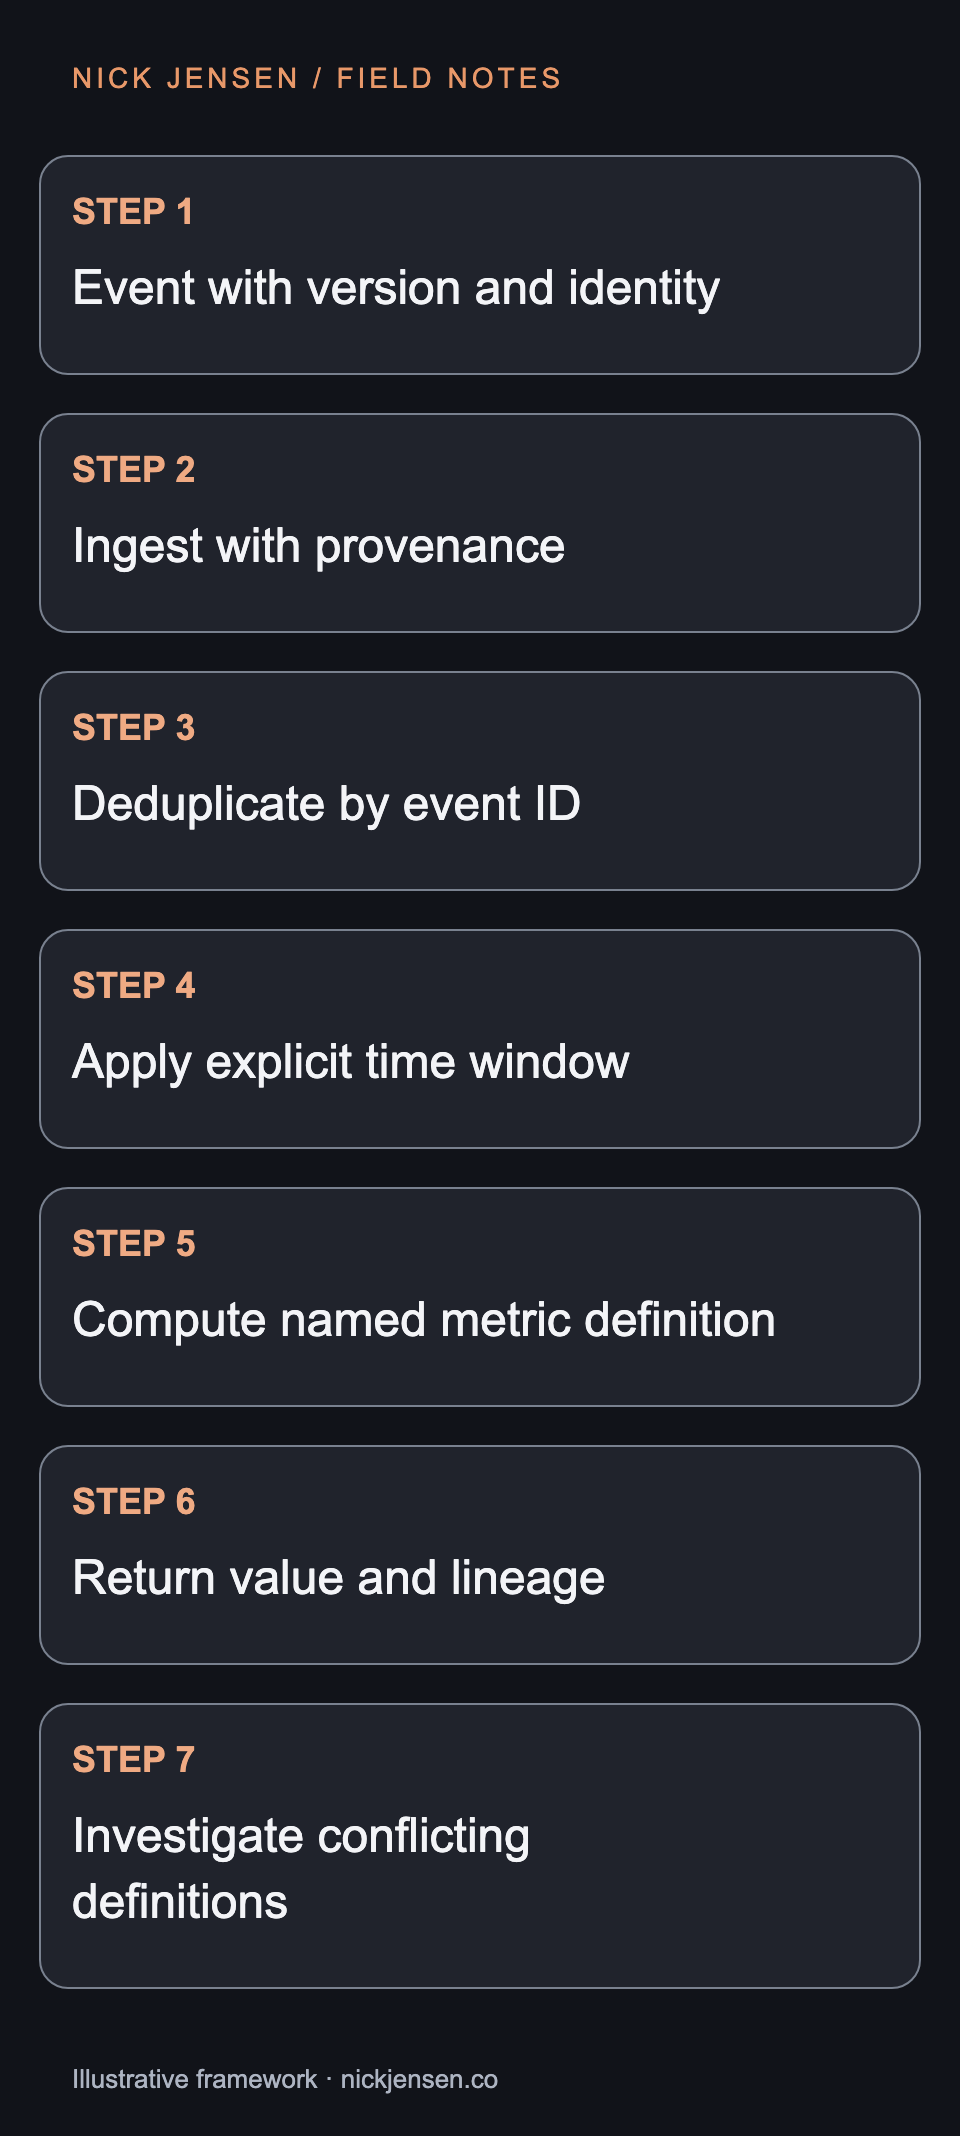
Flow from event with version and identity, then ingest with provenance, then deduplicate by event id, then apply explicit time window, then compute named metric definition, then return value and lineage, then investigate conflicting definitions. A trustworthy answer traces its metric definition back through transformations, deduplication, provenance, and the original event contract.
Preserve the path to the answer
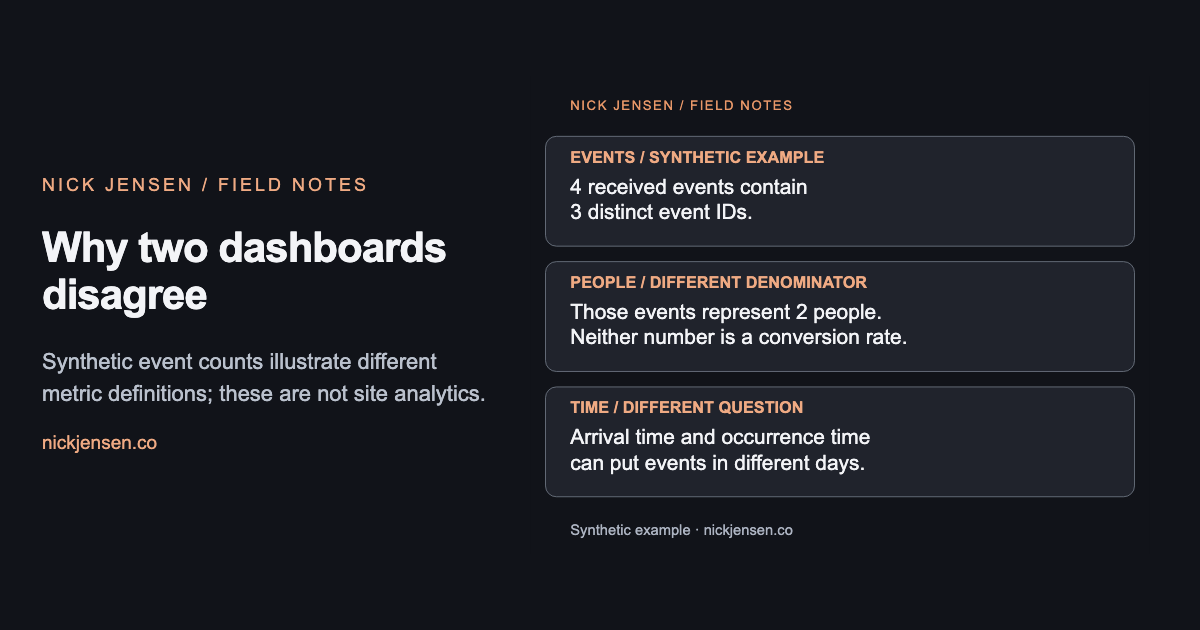
Record the event contract, source identity, deduplication rule, transformation, time window, and metric definition. Keep enough lineage to explain which records contributed to an answer without exposing private payloads to an unauthorized reader. The lineage figure follows that path. The comparison graphic demonstrates why two dashboards may disagree without either having a broken query. Late arrival and occurrence-time windows introduce another distinction: the report needs an explicit adjustment policy.
Why two dashboards disagree
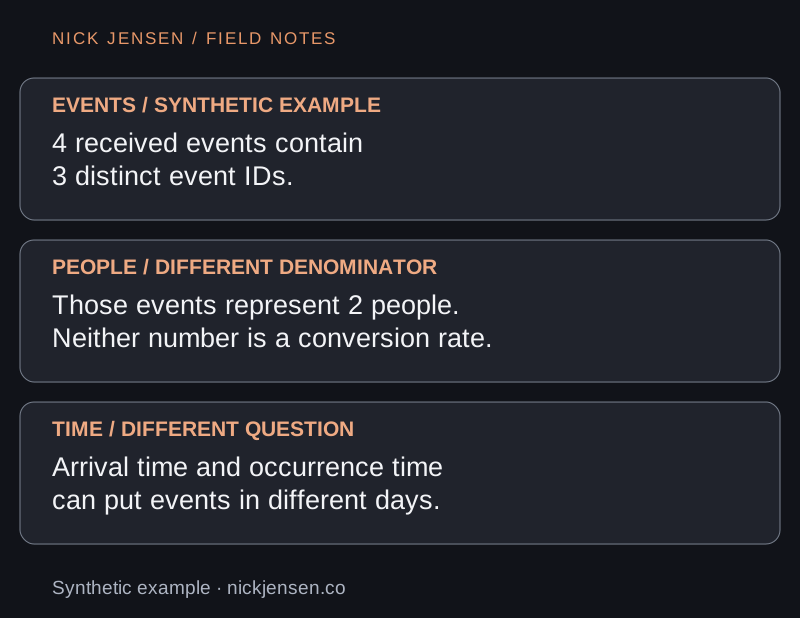
Synthetic event counts illustrate different metric definitions; these are not site analytics.
Synthetic example · Graphic by Nick JensenRead the diagram as text
Events / synthetic example: 4 received events contain 3 distinct event IDs.; People / different denominator: Those events represent 2 people. Neither number is a conversion rate.; Time / different question: Arrival time and occurrence time can put events in different days. Synthetic event counts illustrate different metric definitions; these are not site analytics.
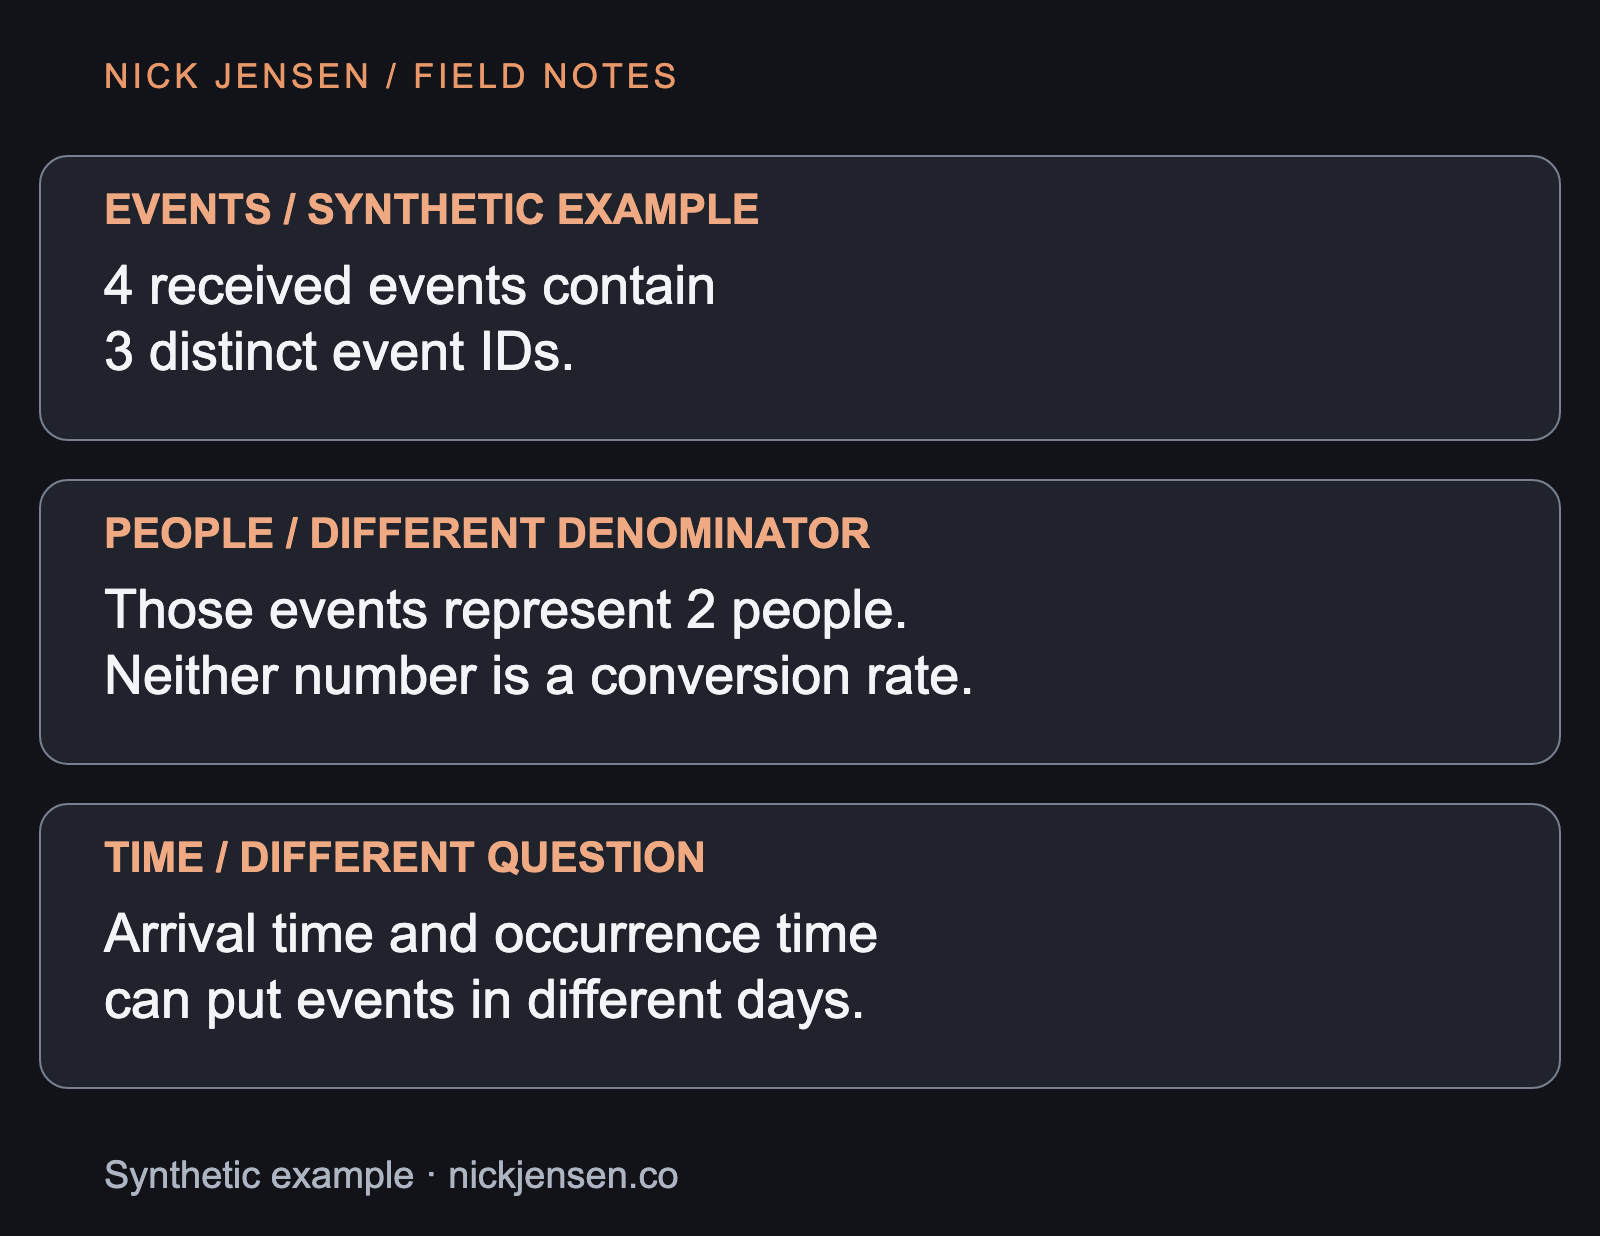
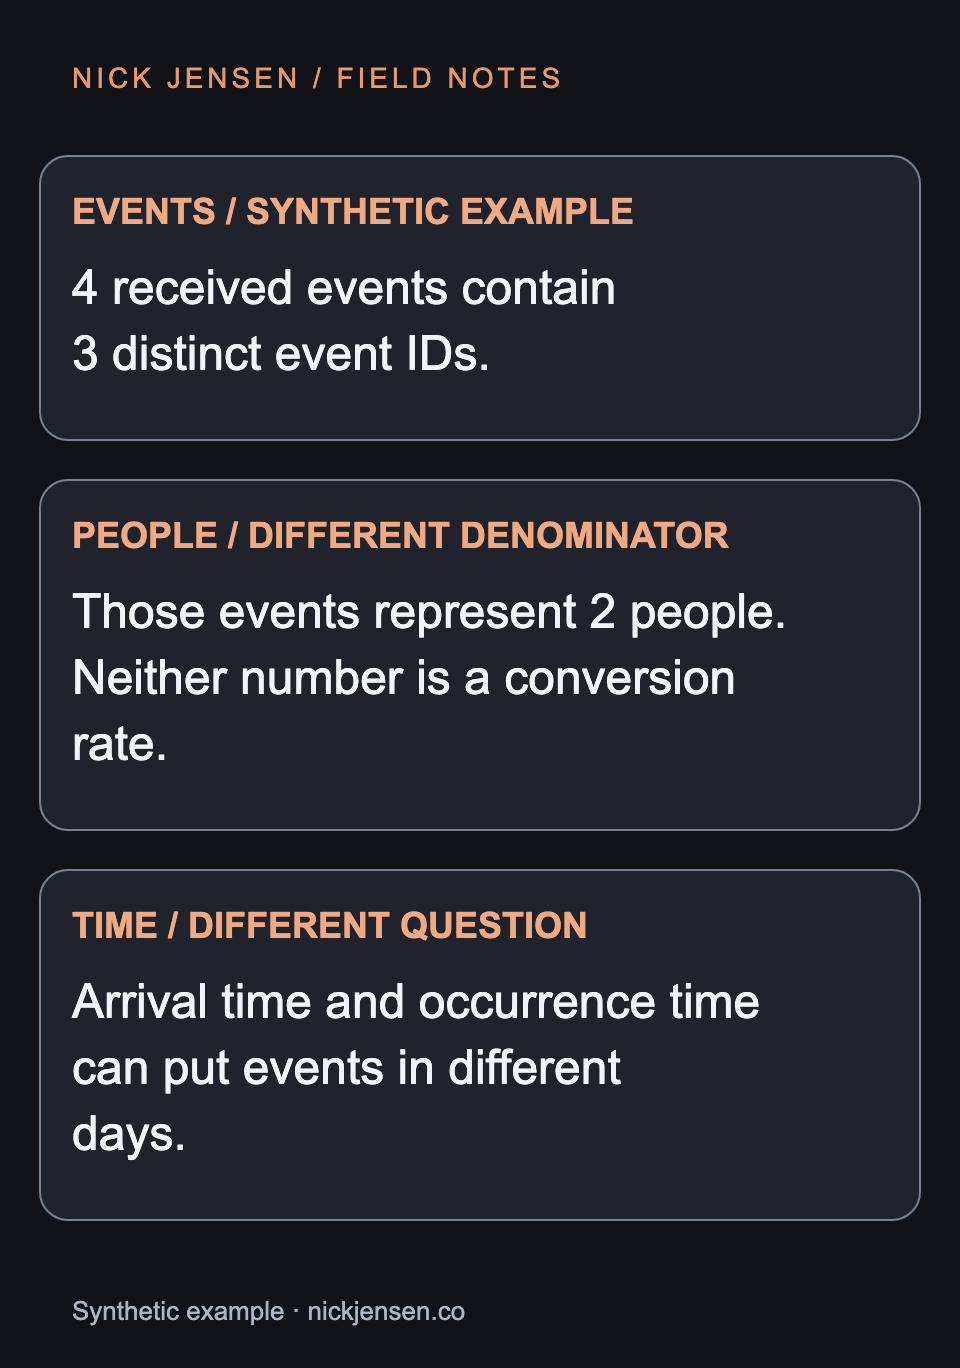
1 const deliveries = [ 2 { id: 'e1', person: 'p1' }, { id: 'e1', person: 'p1' }, 3 { id: 'e2', person: 'p1' }, { id: 'e3', person: 'p2' }, 4 ] 5 console.assert(deliveries.length === 4) 6 console.assert(new Set(deliveries.map(x => x.id)).size === 3) 7 console.assert(new Set(deliveries.map(x => x.person)).size === 2) 8 // Missing: a defined conversion denominator and authoritative completion event.
Test a misleading interpretation
Ask for a conversion rate from the four-delivery fixture. The correct response is that the denominator and completion event are missing. Dividing any convenient pair of counts would create a number without a defined business meaning. Then duplicate e2 and rerun the calculation. The delivery count should change while the distinct-event and people counts remain stable. This counterexample makes the deduplication assumption observable. It still does not establish identity accuracy, consent compliance, or the completeness of a real collector.
Give the definition an owner
A governed metric needs someone who can approve changes and answer semantic questions. Version a meaning change, document the effect on historical comparisons, and show the definition beside an automated answer. Lineage adds storage and maintenance work. Retain the evidence needed for decisions within the organization’s access and retention policy rather than collecting every payload indefinitely. Start with one high-value metric and its source-to-answer trace, then use the front-end event-contract article to close gaps at the producer.